
Distributions - Mathematics

In statistics and data analysis, distributions vary widely in their characteristics and significance. While the normal distribution often steals the spotlight, other distribution types also provide valuable insights into different phenomena.
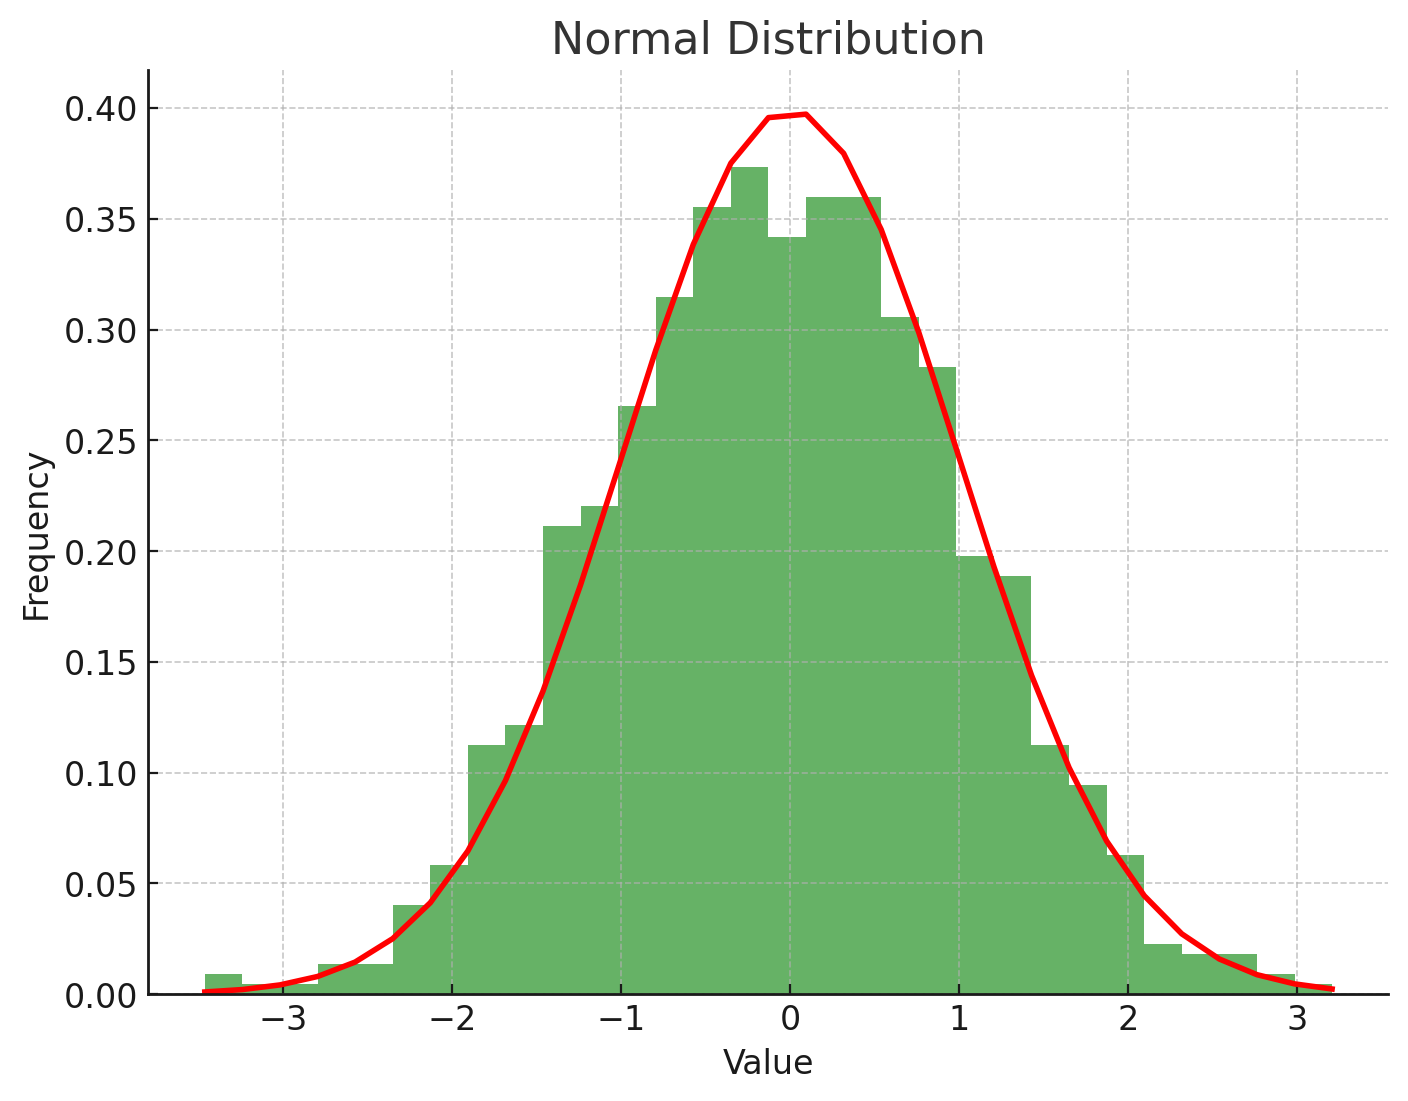
Normal Distribution
The normal distribution, often called the "bell curve," is common in nature and statistics. It's characterised by its symmetrical, bell-shaped curve.
Examples:
Human height
Weight
Blood pressure
Life spans
Prediction Method: Use the average rule
When dealing with normally distributed data, predictions often revolve around the mean or average value. It’s reasonable to expect a 6-year-old child to live to around 75, which is the average lifespan. On the other hand, for a 90-year-old, it’s likely they may live just a few more years, perhaps reaching 95 if they’re fortunate.
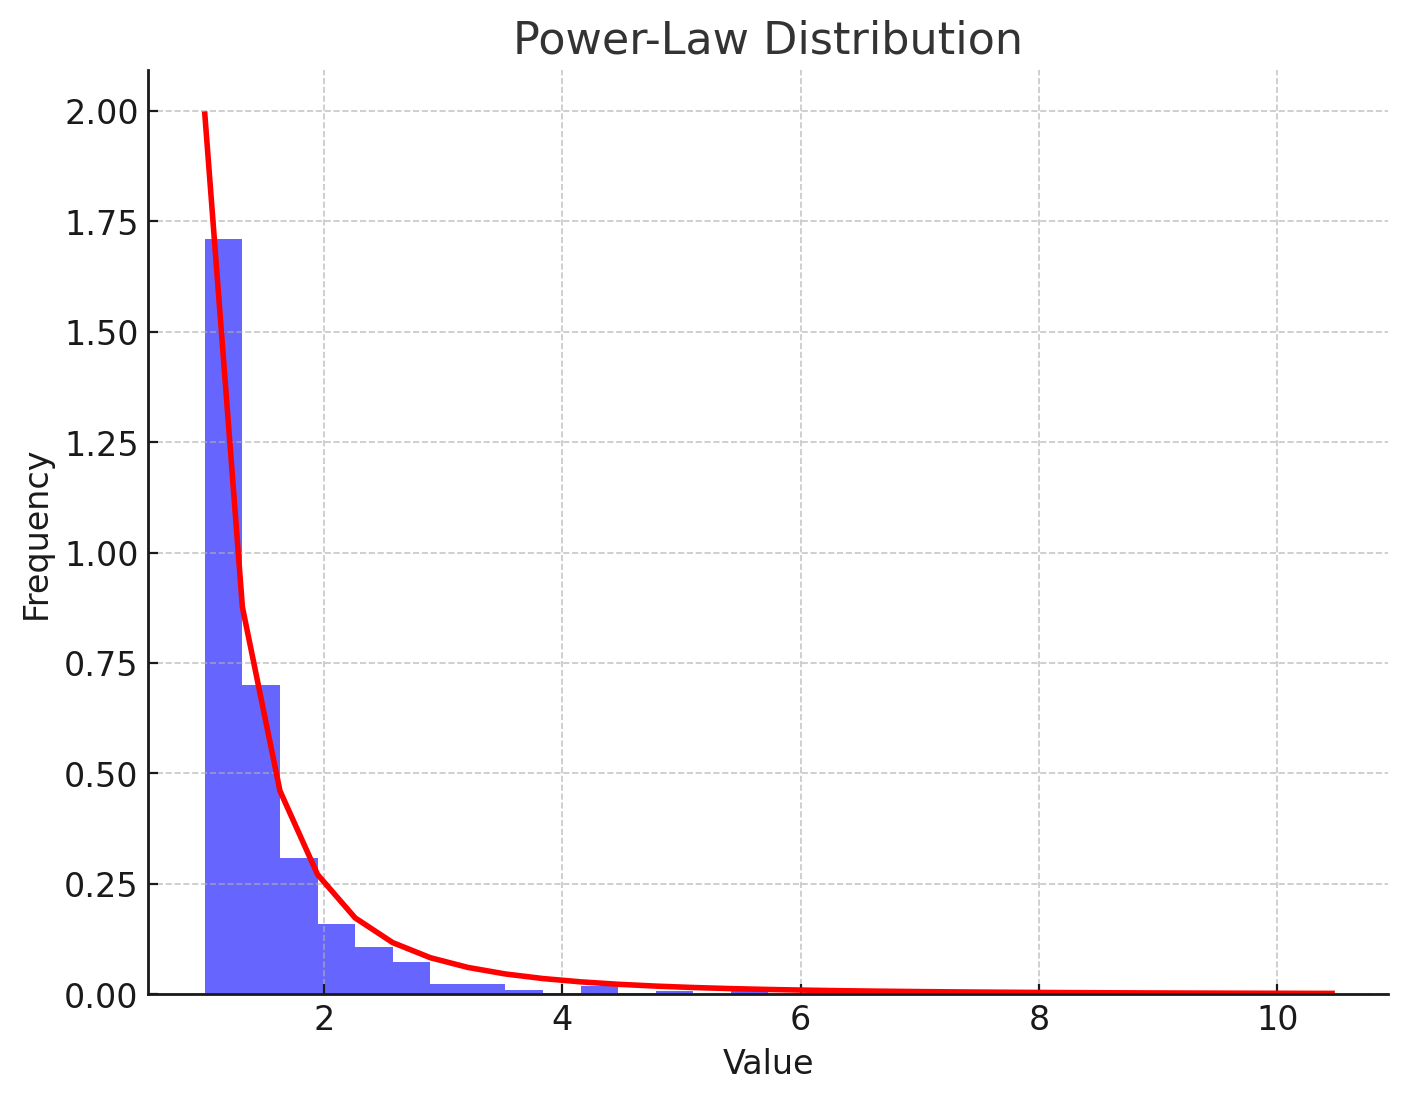
Power-Law Distribution
Power-law distributions are characterised by a "long tail" and are often found in social and economic systems.
Examples:
Population in towns
Wealth distribution
Movie box-office grosses
Prediction Method: Use the multiplicative rule (multiply by a constant)
In power-law distributions, small occurrences are extremely common, while large instances are rare. This distribution helps explain why a small number of items often dominate a large portion of a system. Considering the book sold 1,000 copies in its first week and assuming the sales follow a power-law distribution with an exponent of 2.5, it’s reasonable to estimate that total sales could reach around 2,500 copies.
Erlang Distribution
The Erlang distribution is particularly useful in queuing theory and telecommunications.

Example:
Waiting time between successive calls on a phone network
Prediction Method: Use the additive rule (add a constant number)
This distribution helps model the time between events in a Poisson process. Imagine you’re managing a customer service center where your team usually handles 5 calls per hour. Initially, you estimated it would take 2 hours to handle 10 calls. However, after the first hour, your team had only handled 4 calls, prompting you to adjust your estimate to just over 1 more hour to manage the remaining 6 calls. Altogether, you now expect it to take about 2.2 hours (1 + 1.2 = 2.2 hours).
The Importance of Distribution as a Mental Model
Understanding different types of distributions is useful for accurate data interpretation and prediction. While the normal distribution is widely known and applied, non-normal distributions often reveal more interesting patterns and insights.
By recognising that not everything follows a normal distribution, we can:
Avoid misapplying statistical tools designed for normal distributions.
Gain deeper insights into complex systems and phenomena.
Make more accurate predictions in fields ranging from economics to ecology.